- [email protected]
- Mon - Sat: 8.00 am - 7.00 pm
// S-Trader
Charting
Introduction
Lorem ipsum dolor sit amet, consectetur adipiscing elit.
Core Features
Lorem ipsum dolor sit amet, consectetur adipiscing elit.

Advanced Features
80% of time users spend in social mediafrom their mobile devices.
Working With Charts
Lorem ipsum dolor sit amet, consectetur adipiscing elit.
// S-Trader Charting
Introduction
Charting Overview
Chart Types
Chart Time Frames
Symbol Management
Chart Types
You can chose from eleven (11) built-in chart types: line, candlestick, bars, point and figure, renko, kagi, three line break, equivolume, equivolume shadow, candle volume, heikin ashi.
Chart Time Frames
You can plot time frames from tick / second / minute all the way up to daily, weekly and monthly. You can also plot time frames built out of any custom number of ticks, seconds, minutes, hours, days and weeks.
Symbol Management
You can plot single symbol, multi-symbol as well as composite symbol charts:
- Single symbol charts can be built out of any local data file or streaming data source;
- Multi-symbol can be on a % scale in the same panel or on individual price scales in different panels;
- Composites can be any combination of any number of individual instruments, sourced from local data files or streaming data sources.
Tools & Annotations
You have a large choice of chart tools and annotations in the S-Trader’s charting engine.
- Lines: Trendline, Trendchannel, Vertical Line, Horizontal Line, Speed Lines, Gann Fans, Tirone Levels, Quadrant Lines, Freehand Drawing;
- Fibonaccis: Retracements, Extensions, Arcs, Fan, Time Zones
- Channels: Raff Regression, Error Channels
- Text: Text, Callouts
- Shapes: Ellipse, Rectangle
- Symbols
Chart Studies
The S-Trader charting engine has a wide selection of built-in technical studies. Additionally, you can easily define any custom study you want using the platform's available Quant Script engine.
There are over one hundred built-in technical studies available, conveniently grouped in nine different categories:
- Moving Averages
- Envelopes
- Price Oscillators
- Money Flow Oscillators
- Trend Indicators
- Volatility Studies
- Statistics
- SVA Studies
- Chart-only Studies
Trade Support Elements
You can define expert advisers to show occurrences on charts. You can apply one-to-many advisers on one-to-many symbols on every chart.
Expert advisers previously defined can be used to build consensus reports in any time frame to determine the frequency of occurrence of certain events over any period of time.
Chart Trading
You can manage orders and trade straight from charts.
Trading Systems
Apply systems steps on charts and monitor system status in the trade panel.
Chart Settings
You can edit any aspect of your chart’s looks via the chart settings menu:
- Chart Colors;
- Scale Formats;
- Bar Density;
- Display Settings.
Chart Templates
You can save preferred chart settings, including built-in and custom studies and their formats, as chart templates that can be subsequently applied very easily to other charts.
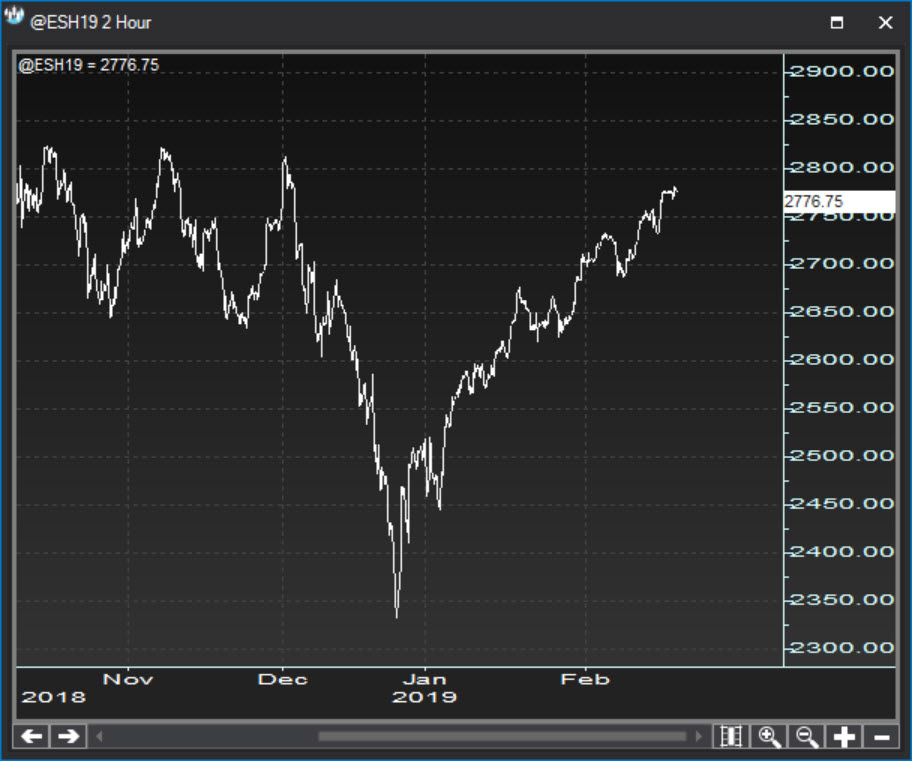
Line Chart
A line chart is the most basic and simplest type of chart that is used in technical analysis. The line chart is also called a close-only chart as it plots the closing price of the underlying security, with a line connecting the dots formed by the close prices of each successive period (tick, second, minute, hour, day, etc).
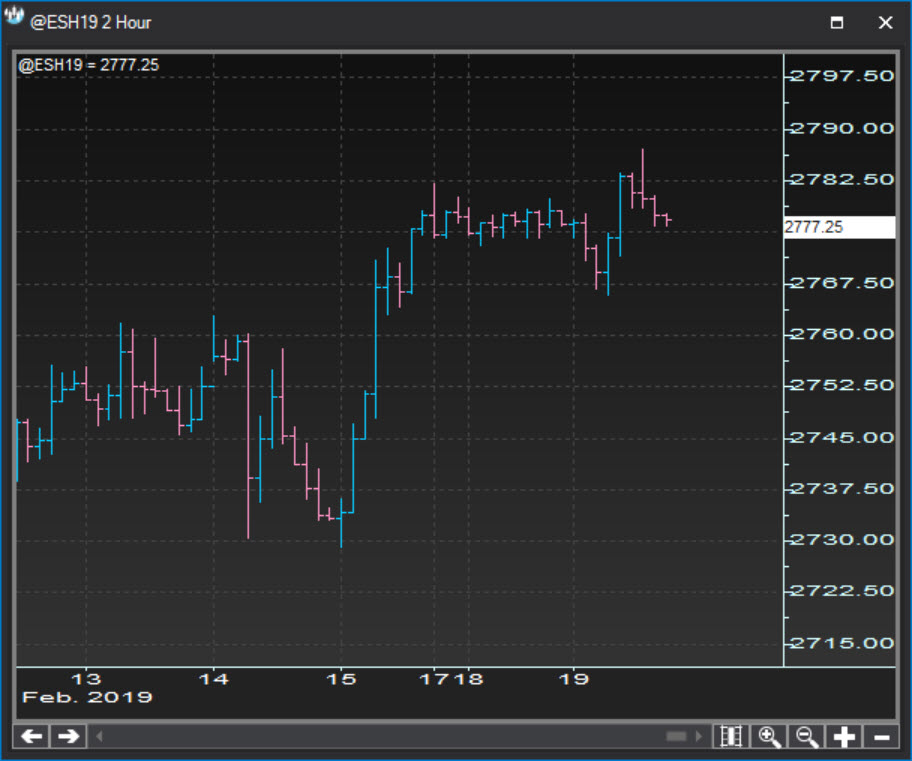
BarChart
One of the basic tools of technical analysis is the bar chart, where the open, close, high, and low prices of stocks or other financial instruments are embedded in bars which are plotted as a series of prices over a specific time period. Bar charts are often referred to as OHLC charts (open-high-low-close charts).
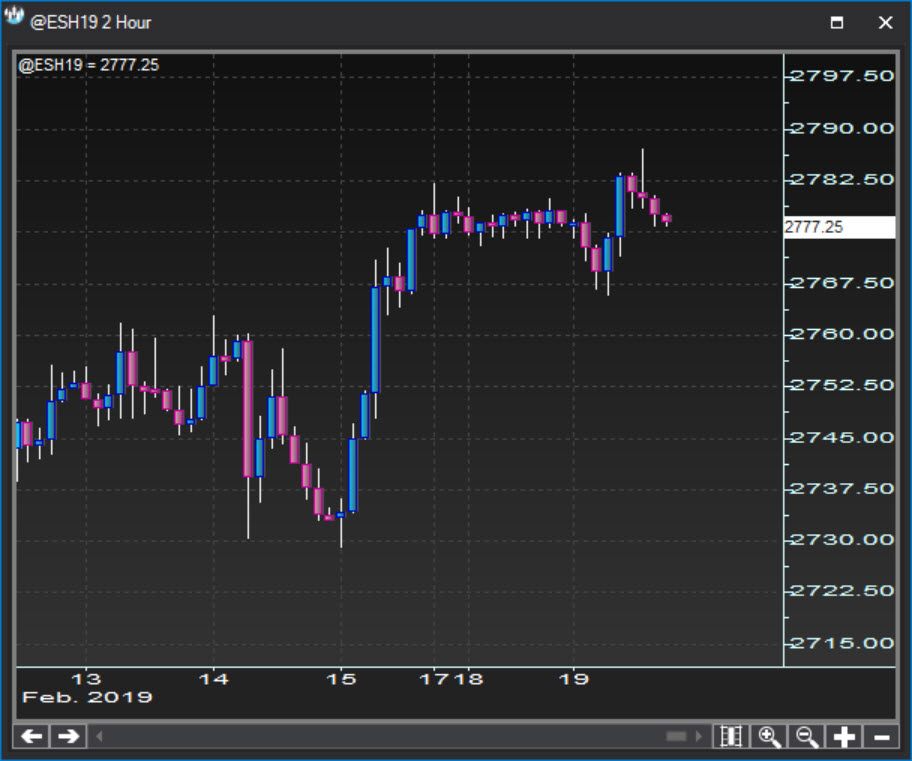
Candlestick
The Japanese began using technical analysis to trade rice in the 17th century. In order to create a candlestick chart, you must have a data set that contains open, high, low and close values for each time period you want to display. The hollow or filled portion of the candlestick is called “the body” (also referred to as “the real body”). The long thin lines above and below the body represent the high/low range and are called “shadows” (also referred to as “wicks” and “tails”).
Point & Figure
Renko Chart
Kagi Chart
Three Line Break Chart
EquiVolume Chart
EquiVolume Shadow Chart
Candle Volume Chart
Heikin Ashi Chart
Refinitiv

- 90 days tick-by-tick;
- 1 Minute data back for 2 years;
- Daily data since inception for all instruments;
- Unlimited symbols;
- Historical, Streaming, Real-time (exchange fees apply).
DTN IQ Feed

- 180 days, true tick-by-tick including bid/ask price at time of trade;
- 1 Minute data back to 2005 for Forex and E-Minis, back to 2007 for Stocks, Futures, Indices;
- Over 10 Years of Daily, Weekly and Monthly data with back-adjusted continuous contract history;
- 500, 1300, 1800, 2500 simultaneous symbols depending on subscription level;
- Historical, Streaming, Real-time (exchange fees apply).
BarChart

- 30 days tick-by-tick, up to 1 Year for extra fee;
- 1 Minute data back for 2 years;
- Daily data since inception for futures, since 1988 for stocks and since 2000 for Forex;
- 100, 200, 500 simultaneous symbols depending on subscription level;
- Historical, Streaming, Real-time (exchange fees apply).
Metastock Xenith

- 90 days tick-by-tick;
- 1 Minute data back for 2 years;
- Daily data since inception for all instruments;
- Unlimited symbols;
- Historical, Streaming, Real-time (exchange fees apply).
Interactive Brokers


- No tick data;
- Second, minute and daily data 1 year back;
- Limited to symbols permitted in your IB account;
- 200, 500 simultaneous symbols depending on subscription level;
- Historical, Streaming, Real-time (exchange fees apply, must have an active IB trading account).
CMC Markets FIX

- Streaming, tick-by-tick (exchange fees may apply).
FXCM

- Tick, minute and daily data;
- 50 simultaneous symbols;
- Historical, Streaming, Real-time.
Friedberg Direct

- Tick, minute and daily data;
- 50 simultaneous symbols;
- Historical, Streaming, Real-time.
Local Data

- Any CSV, TXT, Metastock data file;
- Tick, Second, Minute, Hourly, Daily, Weekly, Monthly data;
- Customizable data templates;
- Historical data only.
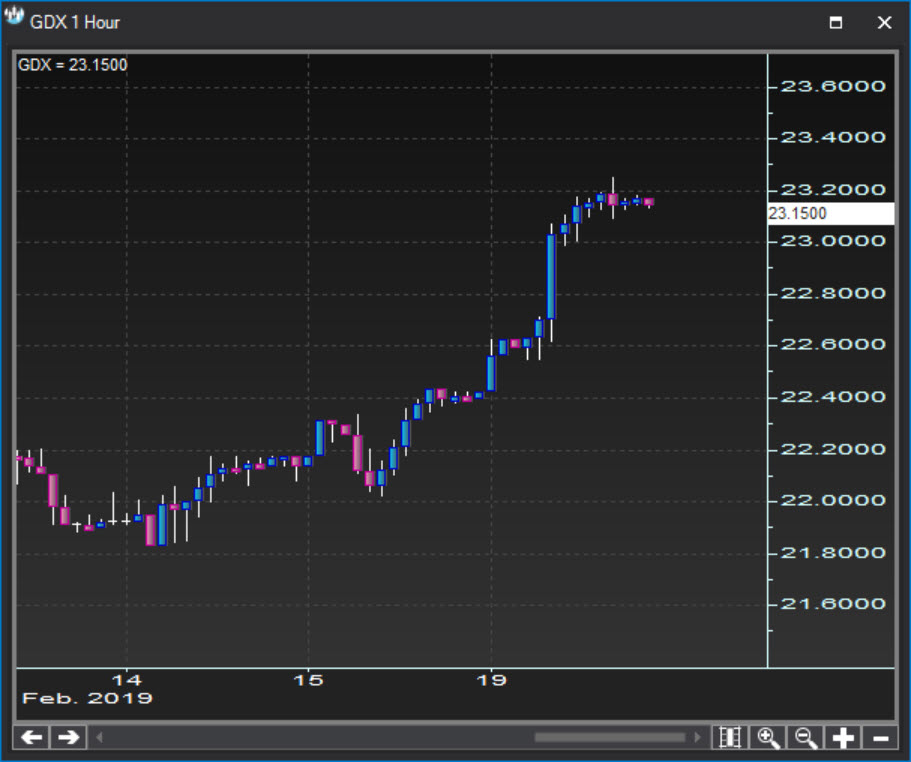
Main Panel
By default, every chart will open with data for the instrument you requested:
Same Panel
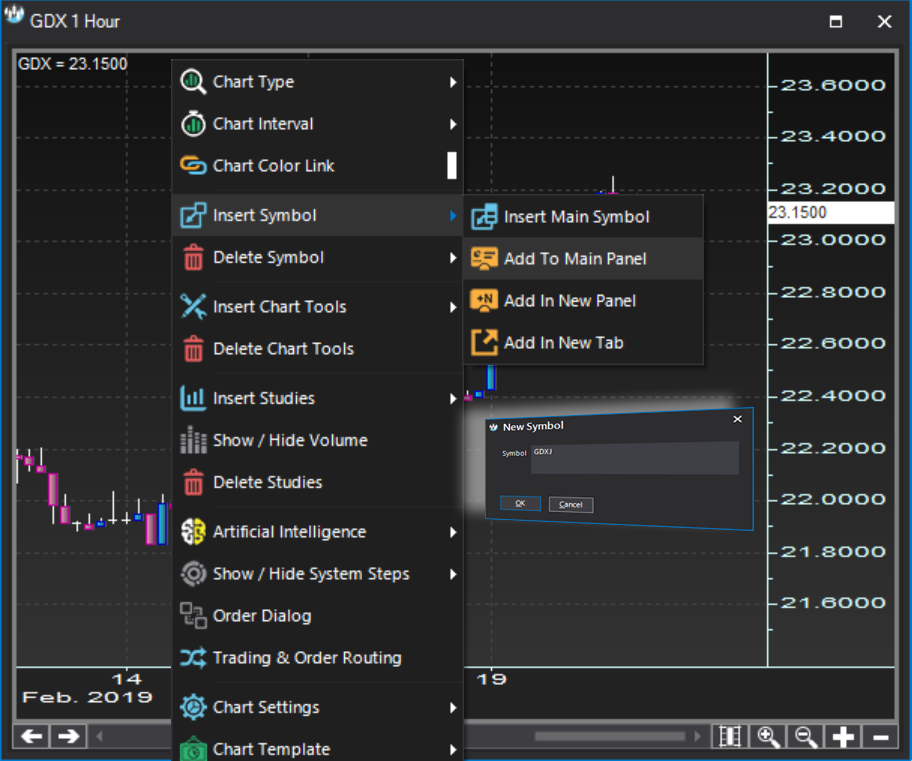
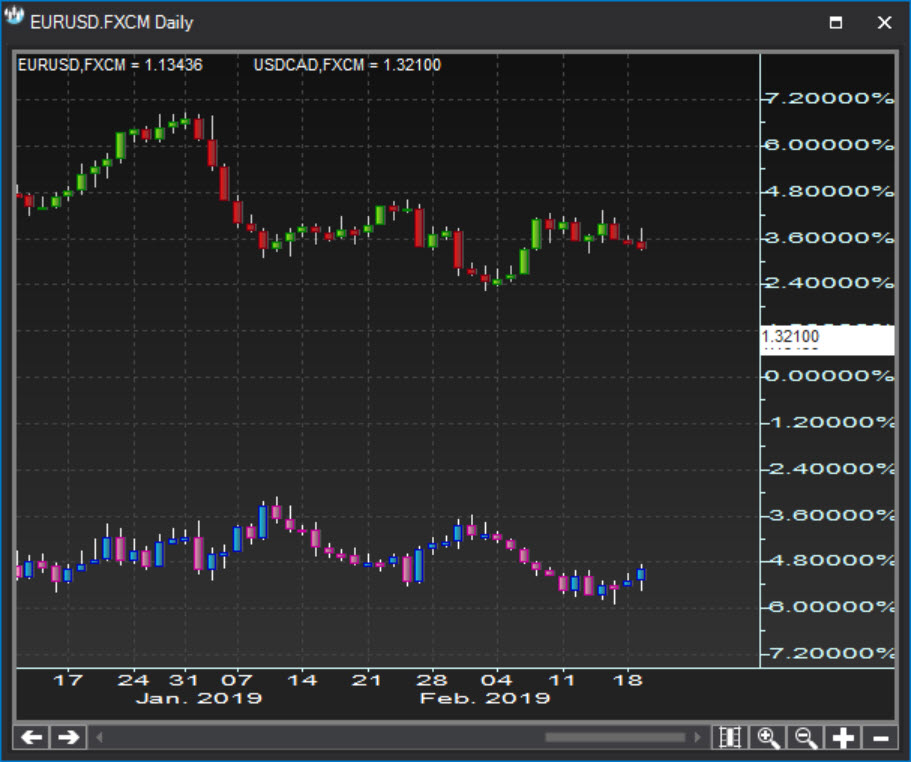
Symbols can be added to the main panel, in which case the plots will become a performance chart:
Separate Panel
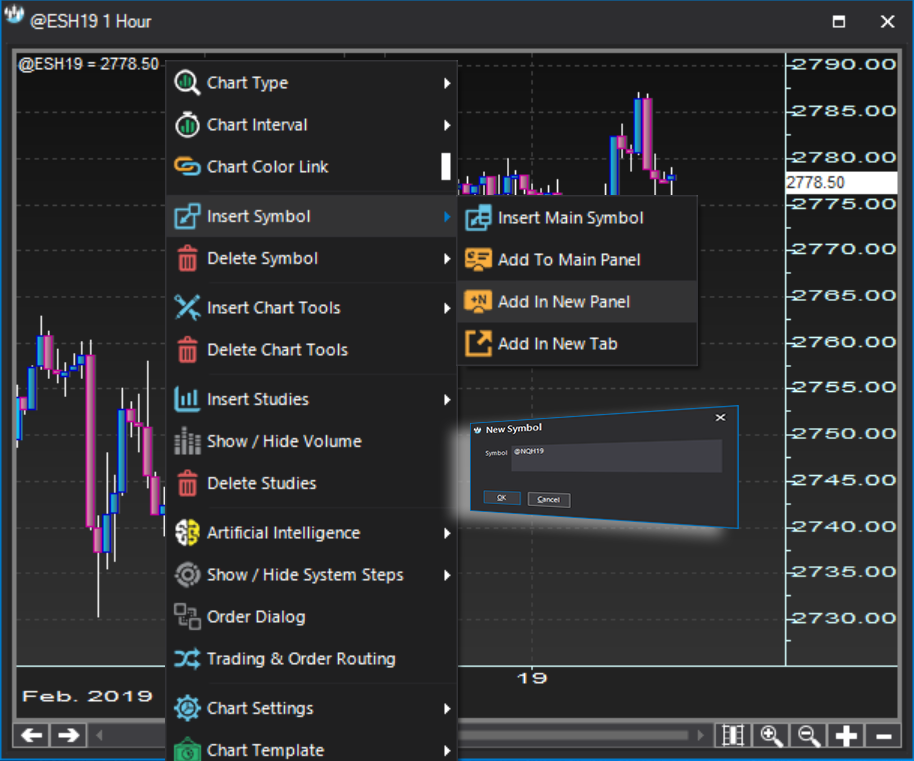
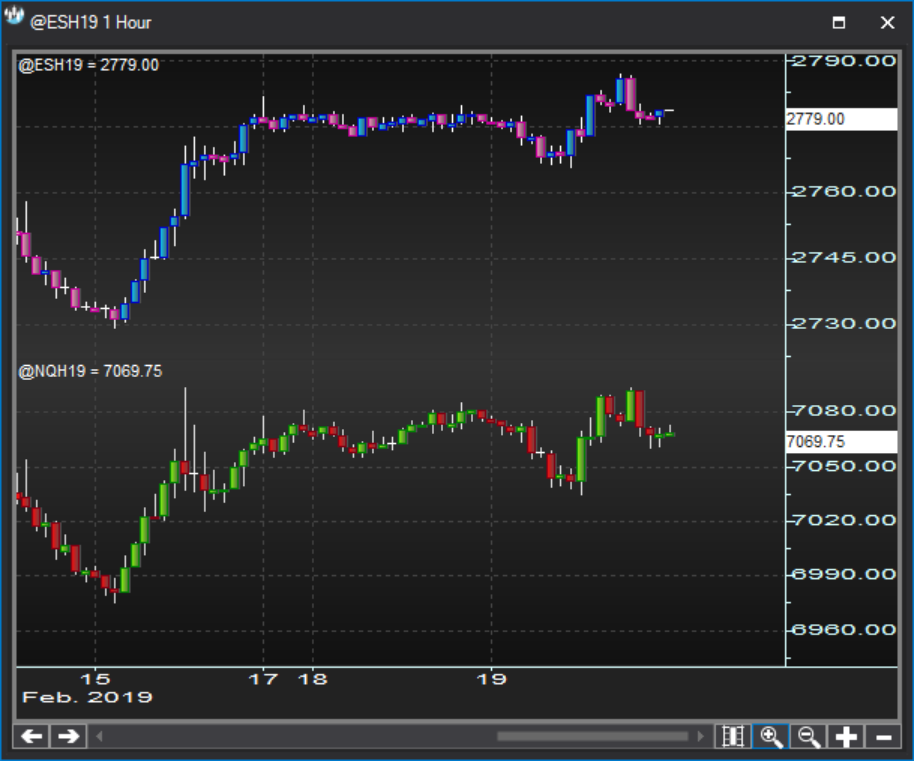
Symbols can be added to a new panel, in which case the plots will be independent:
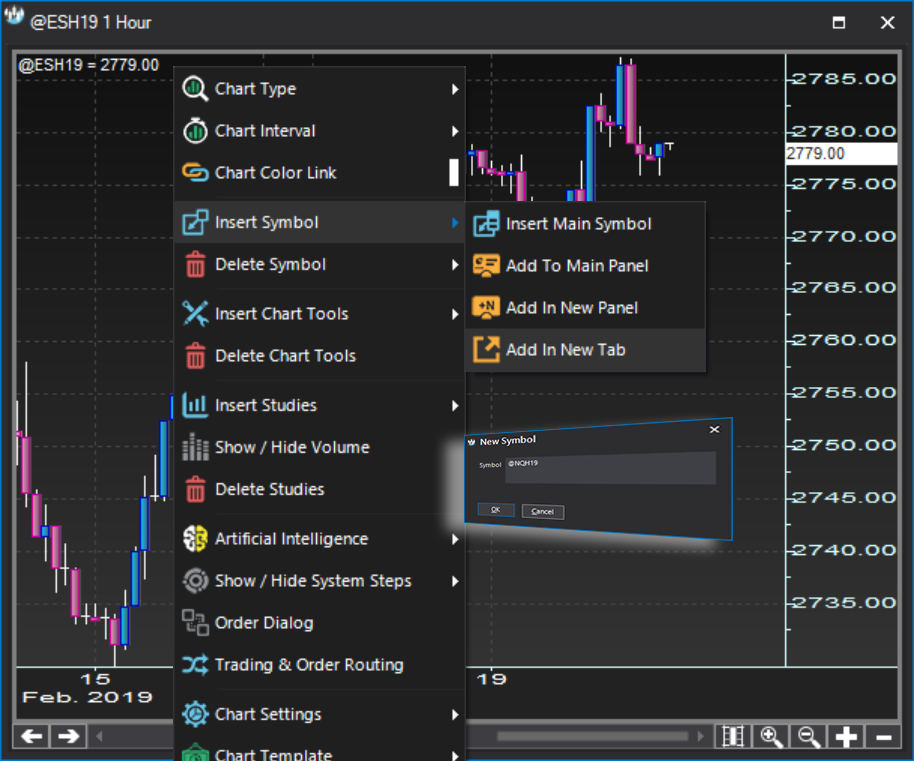
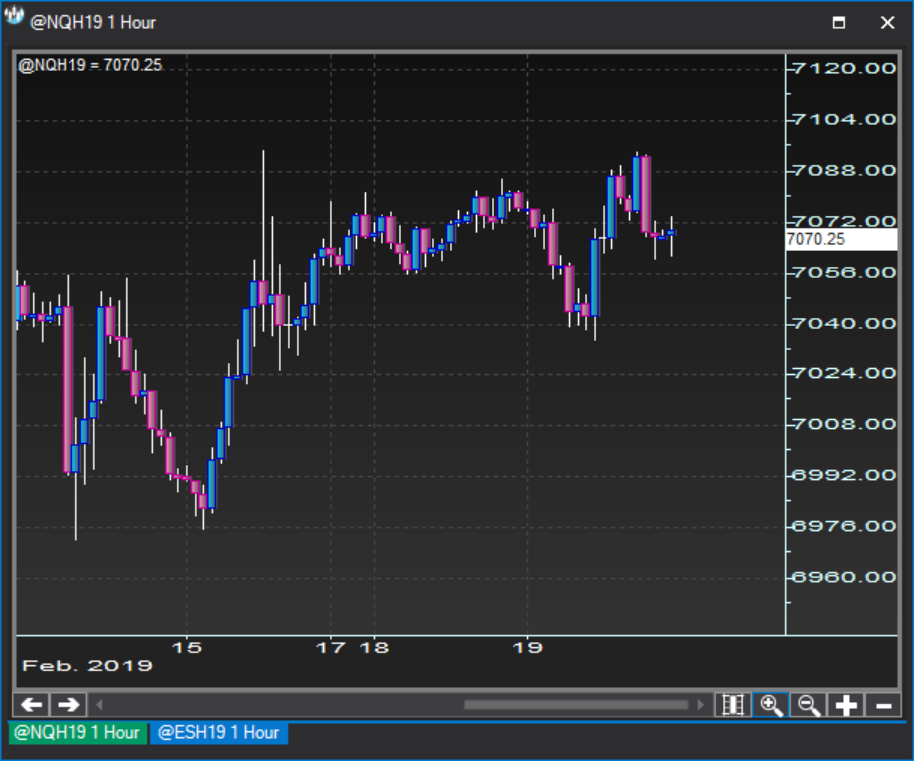
Separate Tab
Symbols can also be added to a new tab, in which case you will end up with two independent charts hosted in the same chart frame for optimal performance and use of pixel space:
Live Data Composite Symbols
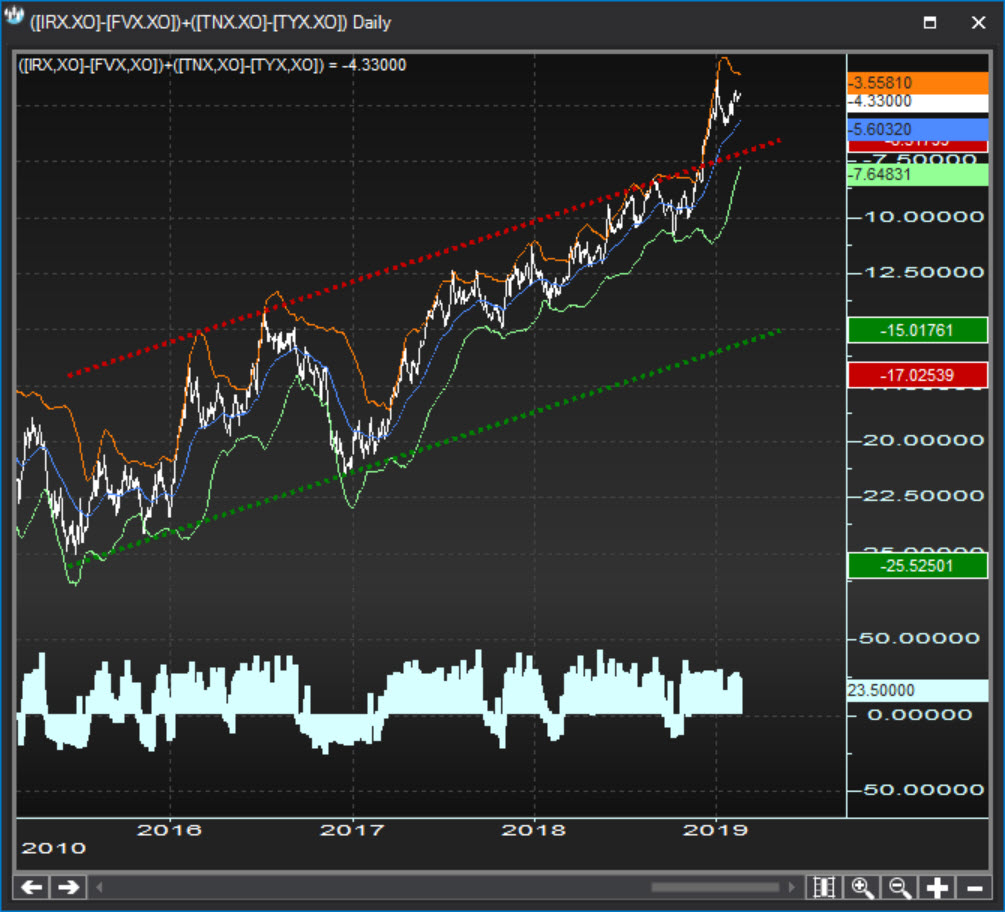
Composite symbols of any level of complexity can be plotted as a "close-only" - or line - chart in any desired time frame. The typical math operator rules apply and symbols must be inserted inside square brackets "[ Instrument Symbol ]".
For instance a composite symbol built as [QGC#]/[QSI#] would end up being plotted as a line chart of the Gold futures / Silver futures continuous contracts.
As another example, a composite symbol built as ([IRX.XO]-[FVX.XO])+([TNX.XO]-[TYX.XO]) would end up being plotted as a line chart of the sum between the 13 week minus the 5 year yield spread and the 10 year minus the 30 year yield spread:
Local Data Composite Symbols
Similarly, composite symbols of any level of complexity can be built out of local data files. To build Local Data Composites you must:
- Peg the local data files using the Local Data dialog;
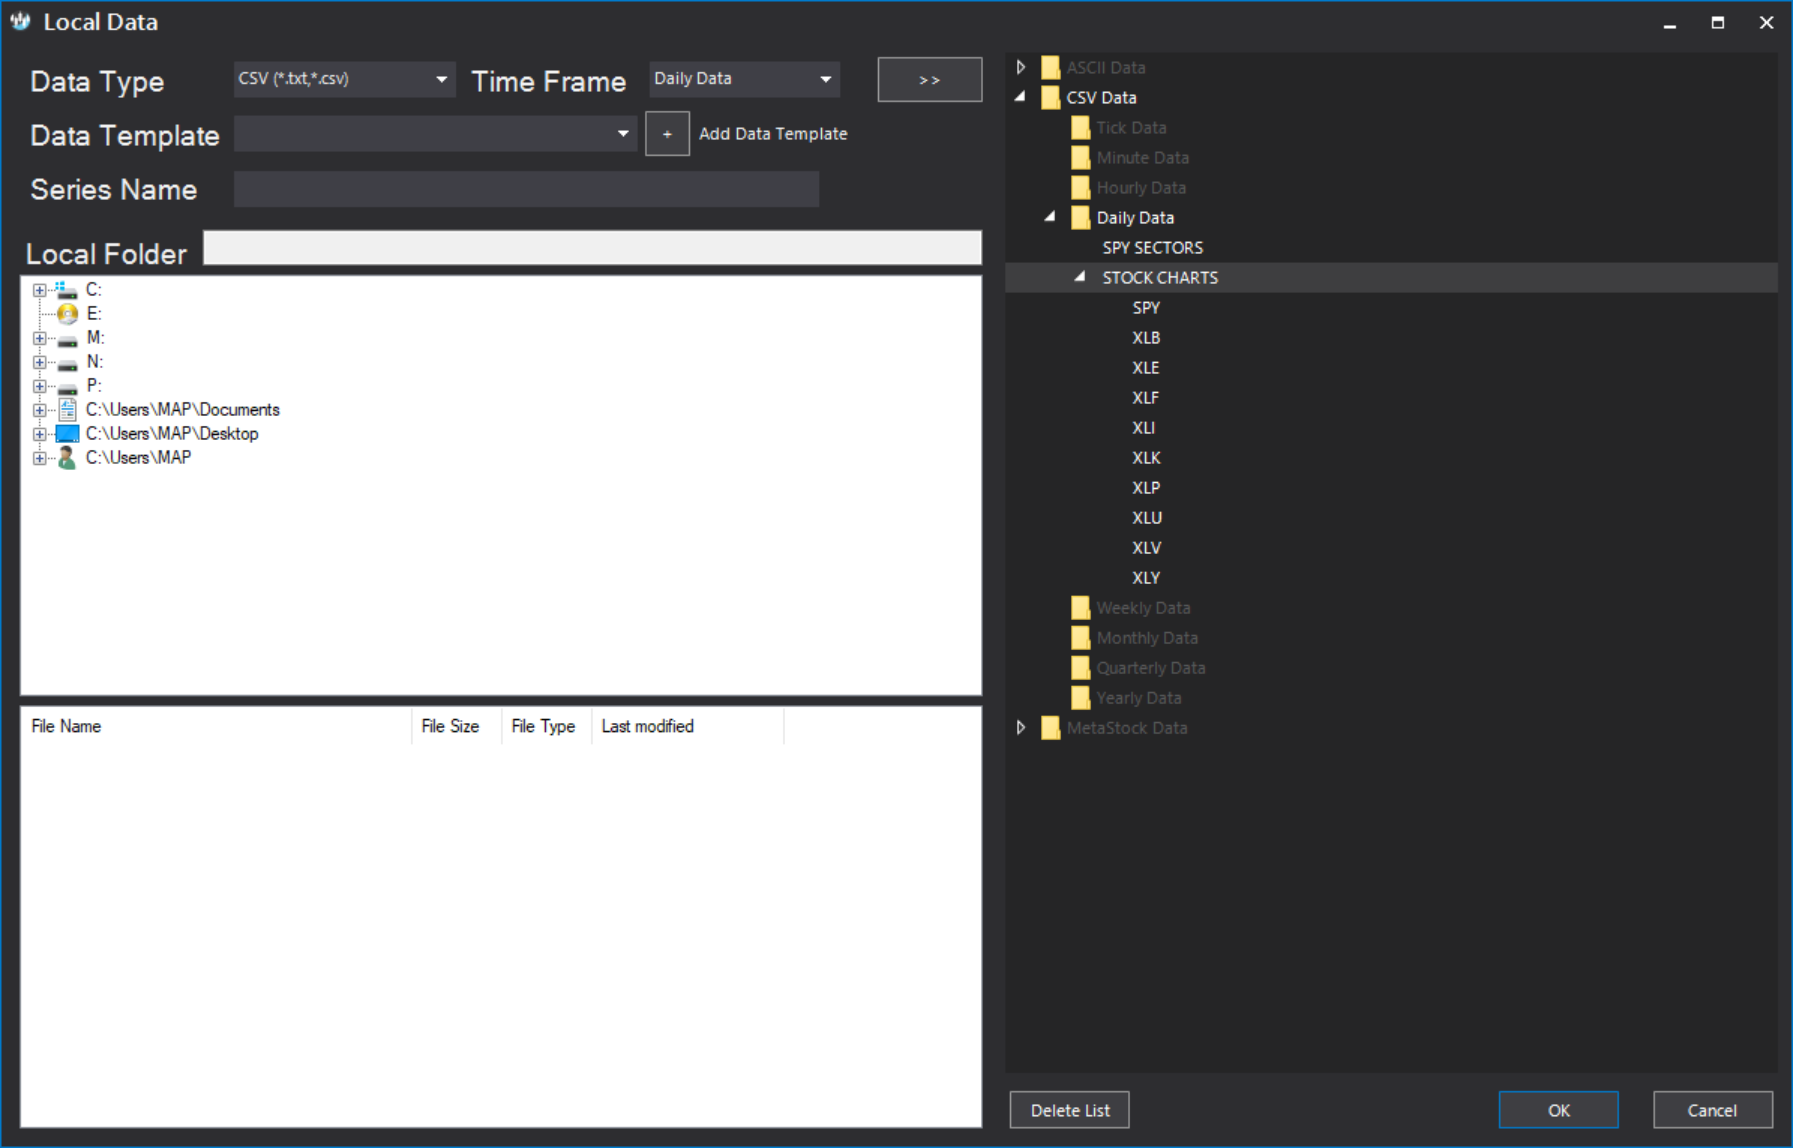
- Alternatively, download data from a streaming provider;
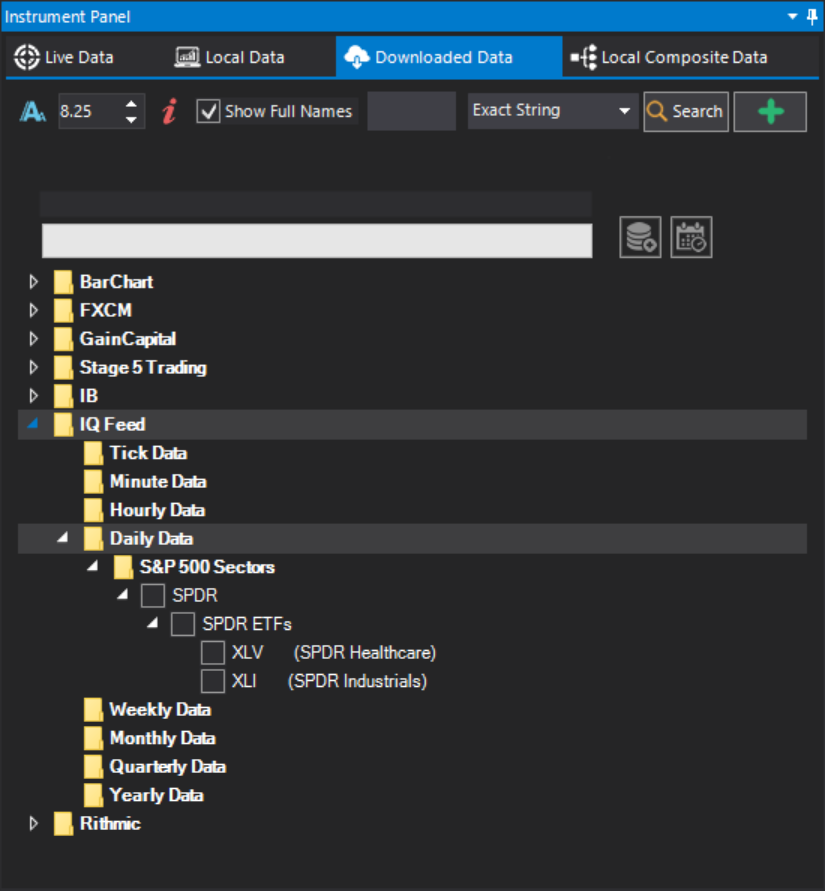
- Use the Local Composite Data dialog to build local data composite symbols;
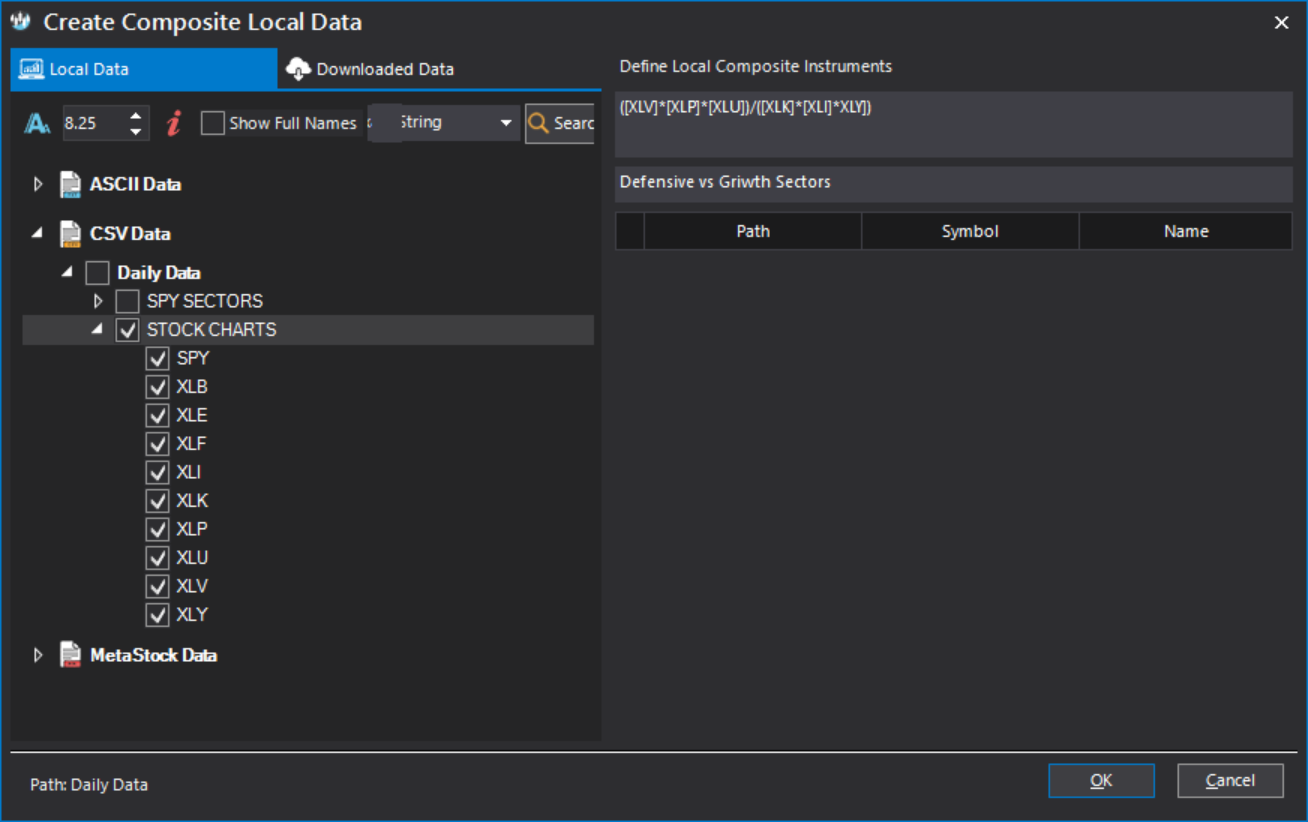
The typical math operator rules apply and symbols must be inserted inside square brackets "[ Instrument Symbol ]". Local data composites will also be plotted as a "close-only" - or line - chart in the time frame they are created.
Charting Engine Overview
Versatile, efficient, advanced.
Chart Types
All popular chart types available: build line, bar, candlestick, point & figure and many other popular charts.
Chart Time Frames
Match the time horizons you focus on with the time frames you study. Chose from multiple standardized time frames or from fully customized broken ones
Symbol Management
Plot single or composite symbols in the same panel, on the same chart or on different tabs.
// s-trader
Core Features
Annotations & Tools
Built-in Studies
Custom Studies
SVA Studies
Expert Advisers
Large selection of chart tools.
Comprehensive chart tools and annotations kit with available lines, fibonaccis, elliott wave labels, channels, text, shapes and more for complete analyses.
Line tools
- Trendlines
- Trendchannel
- Vertical line
- Horizontal line
- Speed lines
- Gann fans
- Tirone levels
- Quadrant lines
- Freehand drawing
Fibonacci tools
- Fibonacci retracements
- Fibonacci extensions
- Fibonacci Arcs
- Fibonacci Fans
- Fibonacci Time Zones
Elliott Wave labels
- Impulse pattern
- Simple corrective pattern
- Triangle pattern
- Double corrective pattern
- Triple corrective pattern
Channels
- Raff regression channels
- Error channels
Text, Shapes and Symbols & Objects tools
- Text tool
- Callout tool
- Ellipse shape
- Rectangle shape
- Symbols & objects
Extensive library of chart studies.
Chose from many built-in studies conveniently grouped in seven categories: moving averages, envelopes, price oscillators, money flow oscillators, trend indicators, statistics and volatility indicators. You can nest built-in studies at any iteration and you can combine them any way you want.
Each study has its own spec sheet presenting in detail its formula, parameters, output value(s) as well as the quant script syntax used to call it inside custom indicators, expert advisers and trading systems.
Moving Averages
- Exponential Moving Average
- Simple Moving Average
- Time Series Moving Average
- Triangular Moving Average
- Variable Index Dynamic Average
- Variable Moving Average
- Volume Weighted Moving Average
- Weighted Moving Average
- Wells Wilder Smoothing
Envelopes
- Bollinger Bands
- Fractal Chaos Bands
- High - Low Bands
- Keltner Channel
- Keltner Channel ST
- Moving Average Envelope
- Prime Number Bands
- Standard Error Bands
- Stoller Average Range Channel
Price Oscillators
- Center Of Gravity
- Chande Forecast Oscillator
- Chande Momentum Oscillator
- Commodity Channel Index
- Coppock Curve
- Detrend Price Oscillator
- Elder Ray Power
- Elder Thermometer
- Fractal Chaos Oscillator
- Intraday Momentum Index
- MACD
- MACD ST
- Momentum Oscillator
- Parabollic SAR
- Percentage Price Oscillator
- Performance Index
- Pretty Good Oscillator
- Prime Number Oscillator
- QStick Indicator
- Rainbow Oscillator
- Rate Of Change
- Relative Strength Index
- Stochastic Momentum Index
- Stochastic Oscillator
- Stochastic Oscillator ST
- True Strength Index
- Ultimate Oscillator
- Ultimate Oscillator ST
- Williams %R
Money Flow Oscillators
- Accumulation Distribution
- Chaikin Money Flow
- Ease Of Movement
- Elder Force Index
- Klinger Volume Oscillator
- Market Facilitation Index
- Money Flow Index
- Negative Volume Index
- On-Balance Volume
- Positive Volume Index
- Price Volume Trend
- Trade Volume Index
- Twiggs Money Flow
- Volume Oscillator
- Volume ROC
- Williams Accumulation Distribution
- Williams Variable Acc Dist
Trend Indicators
- (Wells Wilder) Swing Index
- Accumulative Swing Index
- Aroon
- Directional Movement Index
- Gopalakrishnan Range Index
- Linear Regression
- Random Walk Index
- Range Action Verification Index
- Schaff Trend Cycle MACD
- Schaff Trend Cycle MACDS
- TRIX Tripple Exponential Average
- Vertical Horizontal Filter
Volatility Indicators
- ATR Average True Range
- Chaikin Volatility
- Ehler Fisher Transform
- High Minus Low
- Historical Volatility Index
- Mass Index
- True Range
- Z Value
Statistics
- Average
- Correlation Analysis
- Kurtosis
- Median
- Skewness
- Standard Deviation
- Standard Error
- Typical Price
Weighted Close
Unlimited custom studies.
Build any custom study you want using our built-in function library via the study editor or the study wizard. Use your custom studies on charts or inside expert advisers, portfolio systems, scripted alerts or loop trading systems.

Create your own custom studies using the exceptionally versatile and easy-to-use Quant ScriptTM language. The language’s learning curve is minimal so users can write code very much “out of the box”.

For increased convenience, create your own custom studies using the drag-and-drop functionality of the Code Wizard. The Code Wizard is based off the same Quant ScriptTM language.

All your custom studies built by either the Code Editor or the Code Wizard can be easily managed. Each study can be: password protected, dragged-and-dropped to different groups, encrypted and exported.

Depending on your subscription level, we offer many custom studies at the server level. All these studies can be downloaded and used inside the S-Trader Desktop platform.

Equity valuation studies.
Valuation studies derived directly from company balance sheet data to understand and model intrinsic values. Compare benchmark and actual valuation multiples to understand how fundamental value is created or eroded.

The SVA equity valuation studies are extremely relevant to equity traders and investors. Thanks to our partnership with our friends at Strategic Analysis Corporation (1994), the S-Trader platform gives you the ability to plot popular technical studies and fundamental studies based on balance sheet analysis all in the same frame / window. In addition, the Quant ScriptTM engine allows you to write scripts using the built-in technical and statistical functions, the SVA equity valuation functions or a combination of both. The SVA equity valuation functions can in fact be nested at any iteration inside any other technical and statistical function for some truly powerful and objective analysis and scripting on the firm’s intrinsic value and stability, as they result directly from the firm’s balance sheet.
SVA Price Multiple function
This function returns the relevant price multiples of the stock.

Bubble Valuation Multiples
- High Bubble 8 (HB8)
- High Bubble 7 (HB7)
- High Bubble 6 (HB6)
- High Bubble 5 (HB5)
- High Bubble 4 (HB8)
- High Bubble 3 (HB3)
- High Bubble 2 (HB2)
- High Bubble 1 (HB1)
- Bubble (BB)
Growth Valuation Multiples
- Mid Super Growth (MSG)
- Low Super Growth (LSG)
- Super Growth (SG)
- Mid Growth (MG)
- Growth (G)
Normal Valuation Multiples
- High Conservation (HC)
- High-Mid (HM)
- Normal (G)
- Low-Mid (LM)
- Low Conservation (LC)
Blue Valuation Multiples
- Blue (BL)
- Deep Blue 1 (DB1)
- Deep Blue 2 (DB2)
- Deep Blue 3 (DB3)
- Deep Blue 4 (DB4)
- Deep Blue 5 (DB5)
- Deep Blue 6 (DB6)
Future Market Value function
This function returns the inferred future fair value of the stock.

Stability Ratio function
This function measures the balance sheet stability of the stock and can be viewed as a forward-looking measure of future stock price volatility.
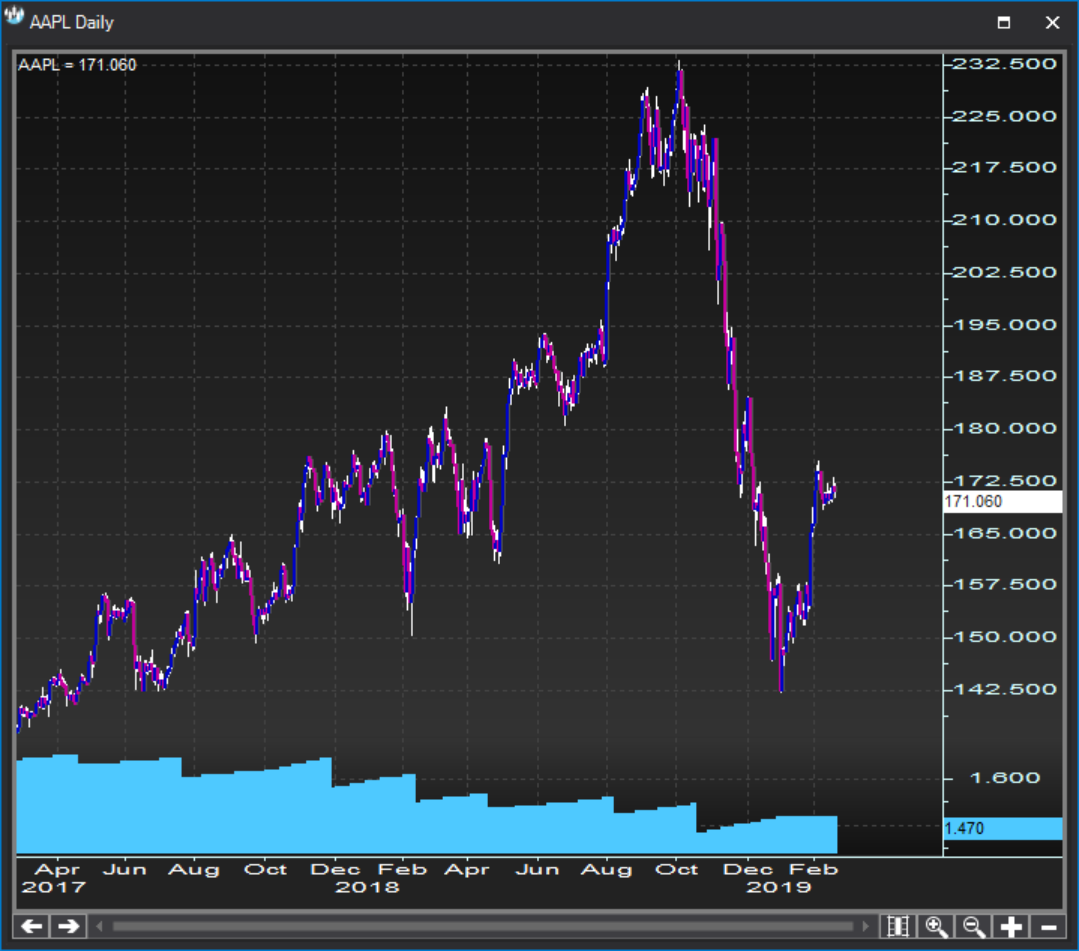

Unlimited expert advisers.
Manipulate chart visuals based on market events and occurrences. Color bars, display banners or plot symbols based on algos that measure what you deem important.

Organize expert advisers in groups and apply them to specific symbols on charts. Apply and remove one to many, many to one and many to many expert advisers to symbols.

Create conditions for any bullish or bearish events. Represent them on charts by coloring bars, displaying banners or plotting symbols. Get “pinged” by text pop-ups or sound alerts.
// s-Trader
Advanced Features
Loop System Steps
Algo steps posted on the charts.
Get trading system results posted on your charts along with annotations, tools and other trade support elements.
Chart Trading Panel
Trade from the charts.
Place and change orders with all popular flags right off the charts. Control exposure, join or hit bids and offers with pre-define slippage, reverse and exit trades – all with one click.
Consensus Reports
Gauge markets on the go.
Build any expert adviser and run it on any chart. Gauge bullish or bearish occurrences with ease over any time horizons.
// s-trader
Working with Charts
Chart Settings
Chart Templates
Chart Management

Fully customizable looks.
Customize every element of your charts such as colors, fonts, scale, bar density, grids, style and more.
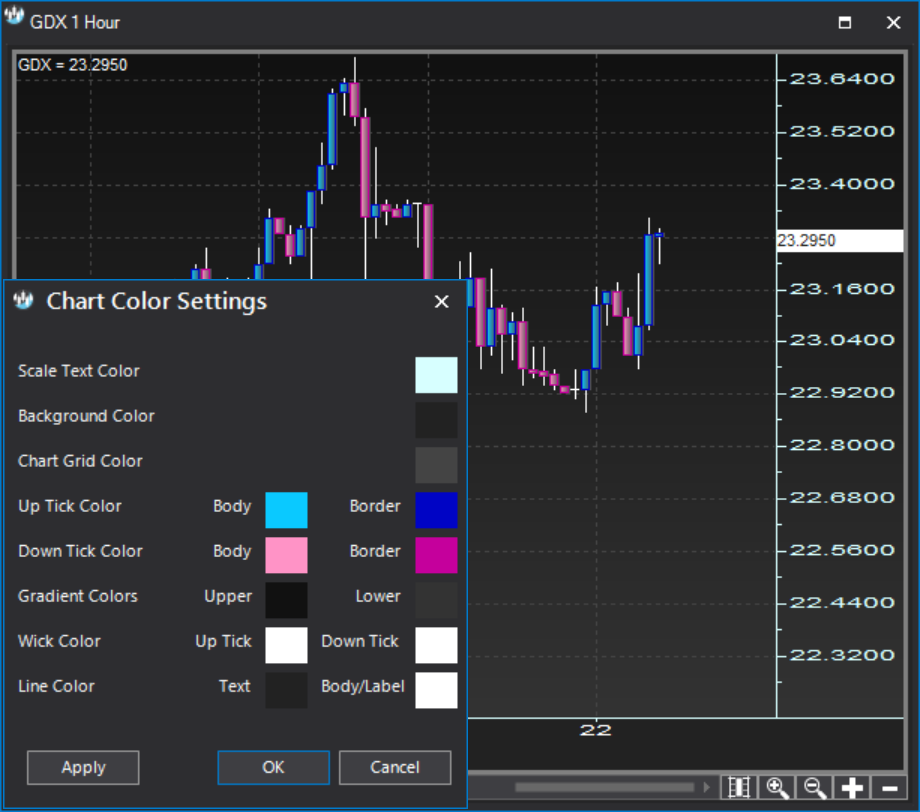
Chart Colors
Every aspect of your chart's color palette is customizable via the Chart Color Settings dialog:
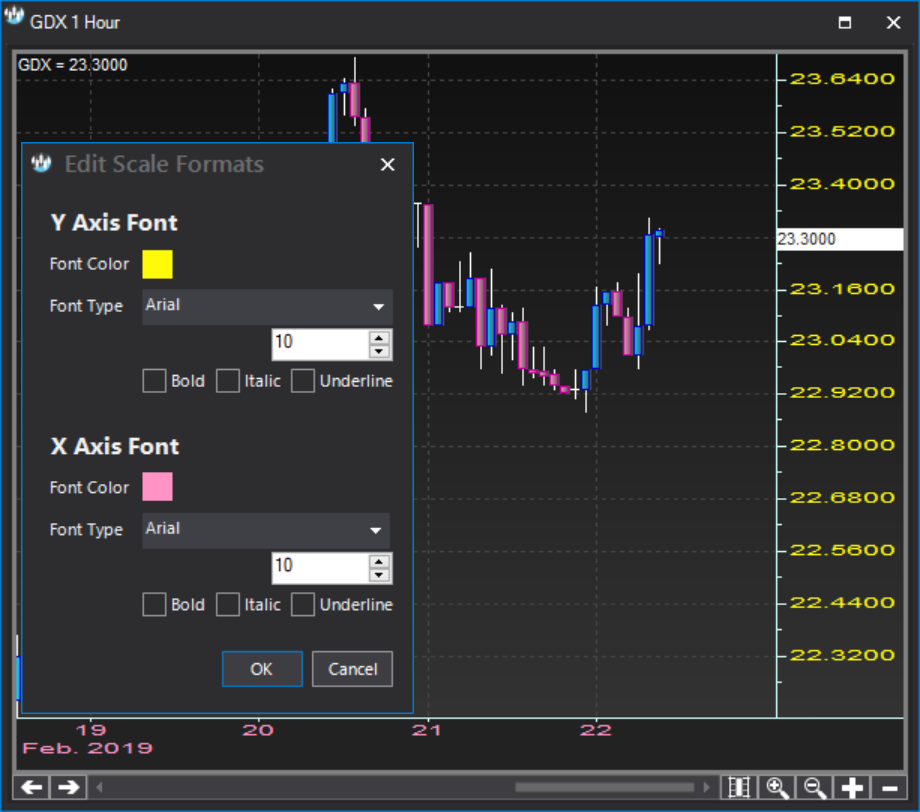
Scale Formats
You can format scale font color, type and size via the Edit Scale Formats dialog:
Price Scale
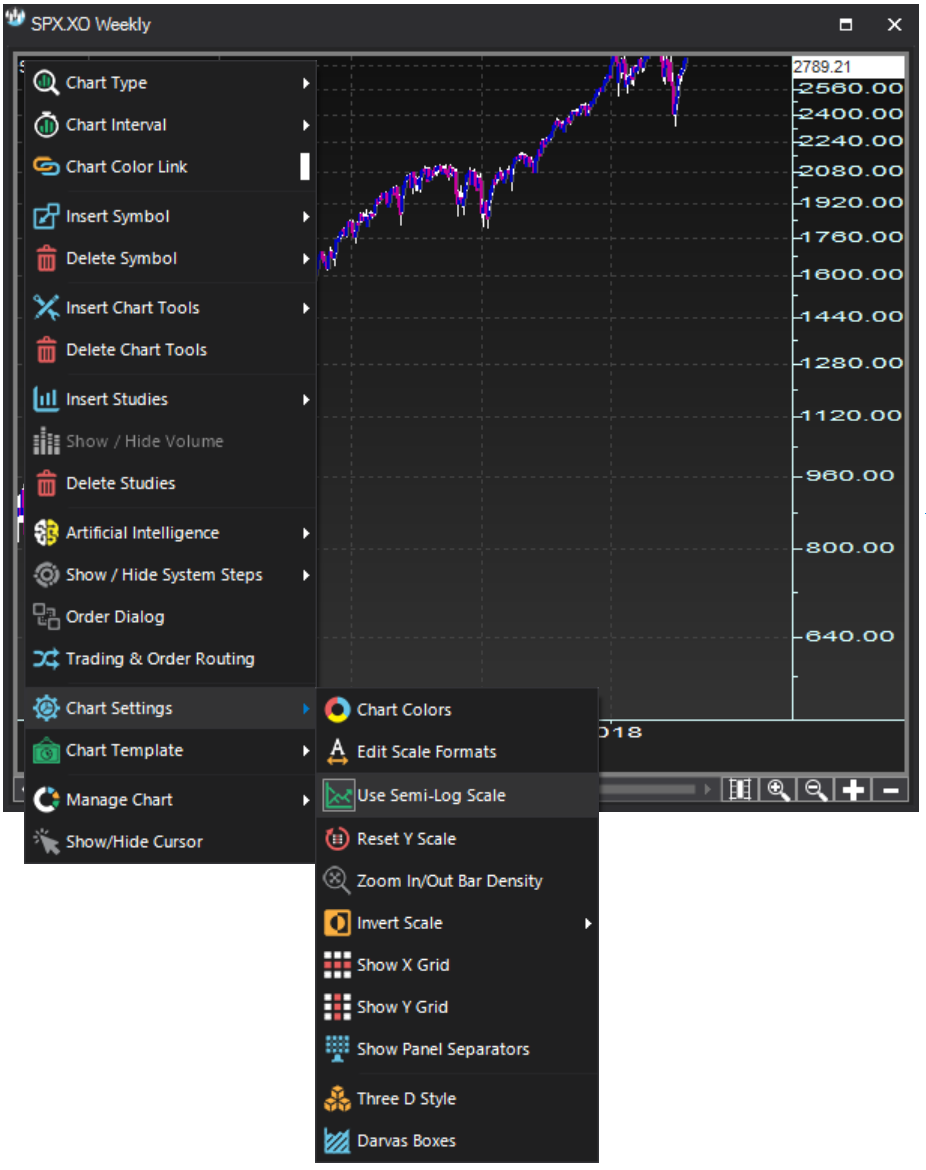
You can chose between nominal and semi-log price scale:
Resetting Price Scale
You can contract and expand the Price (Y) scale and you can then revert it to entirely fit your chart frame:
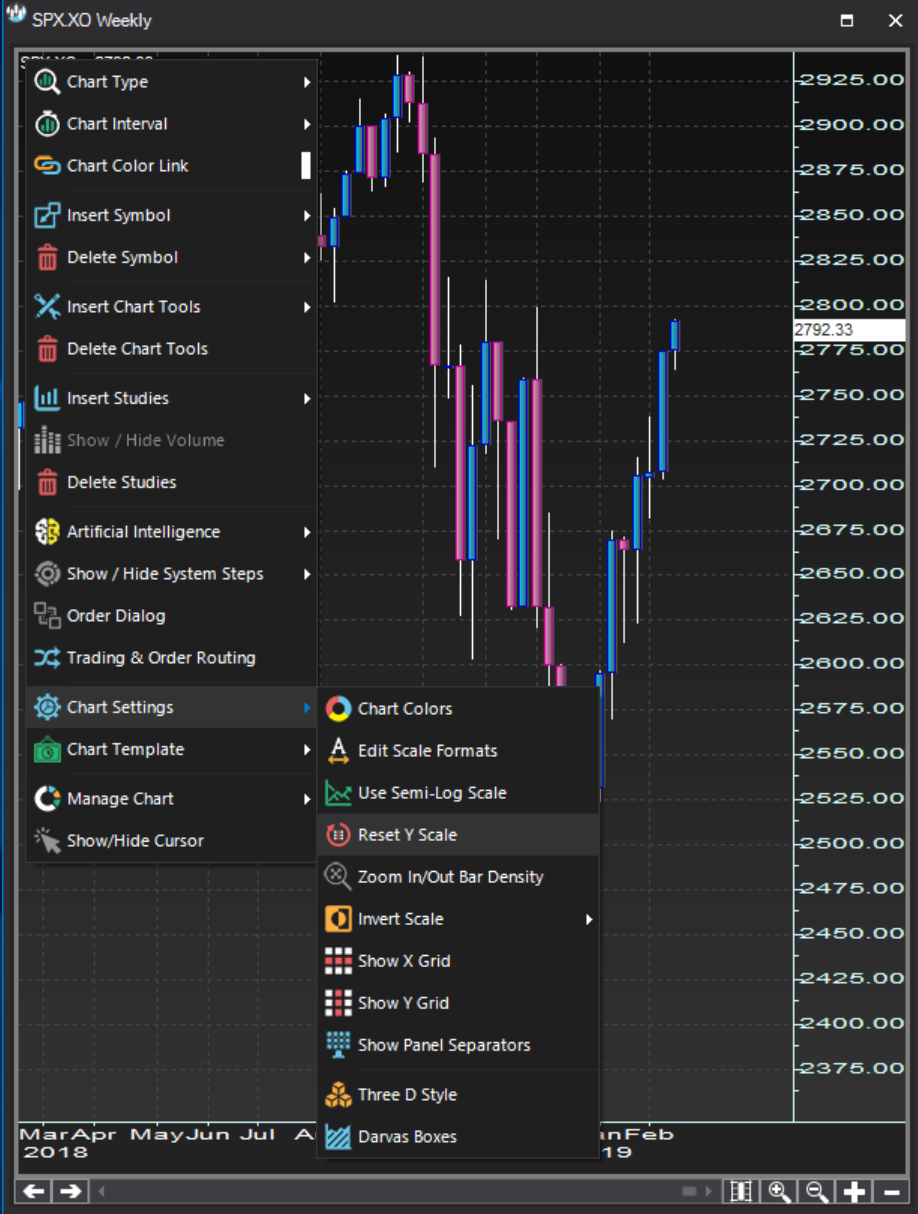
Chart Bar Density
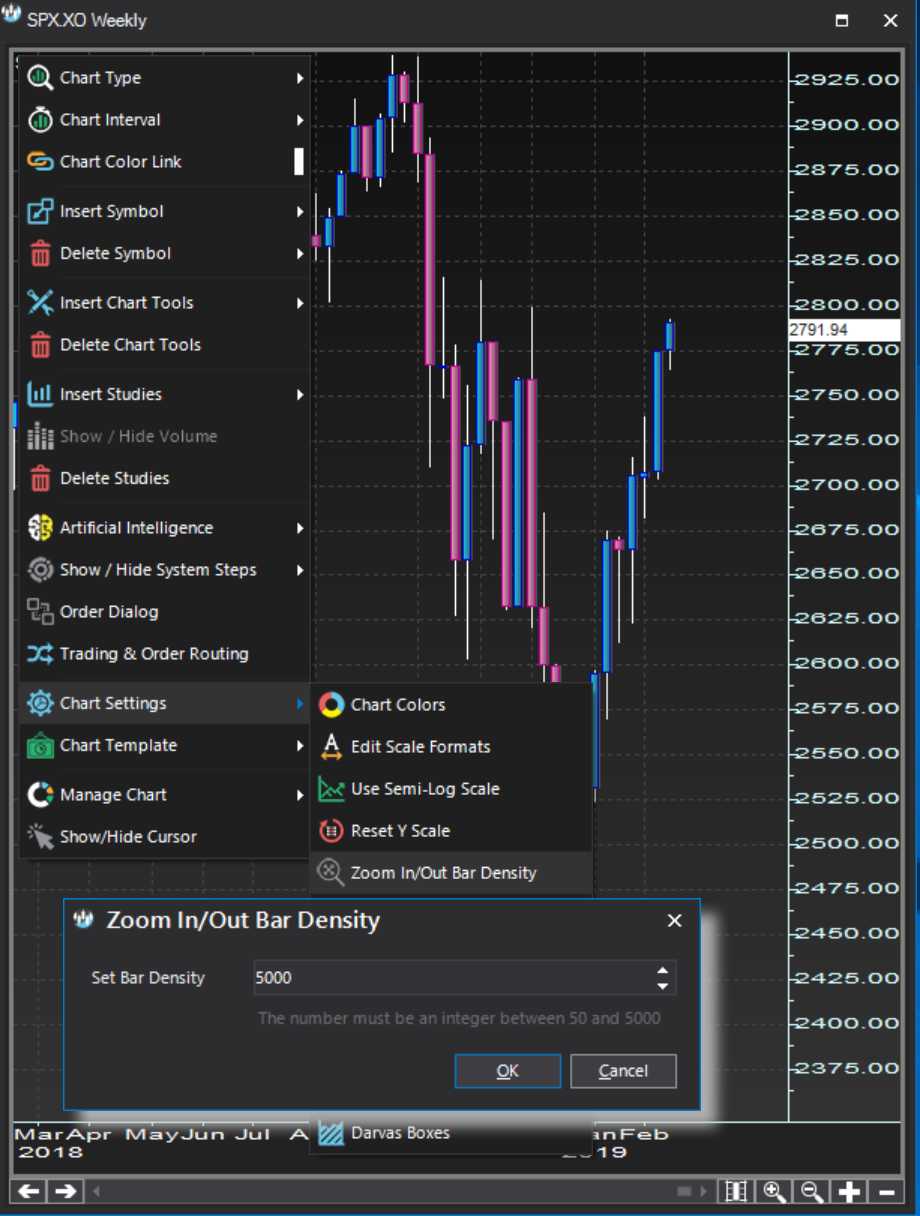
You can set a maximum zoom-out chart bar density:
Invert Scale
You can invert price scales on every chart on a symbol-by-symbol basis:
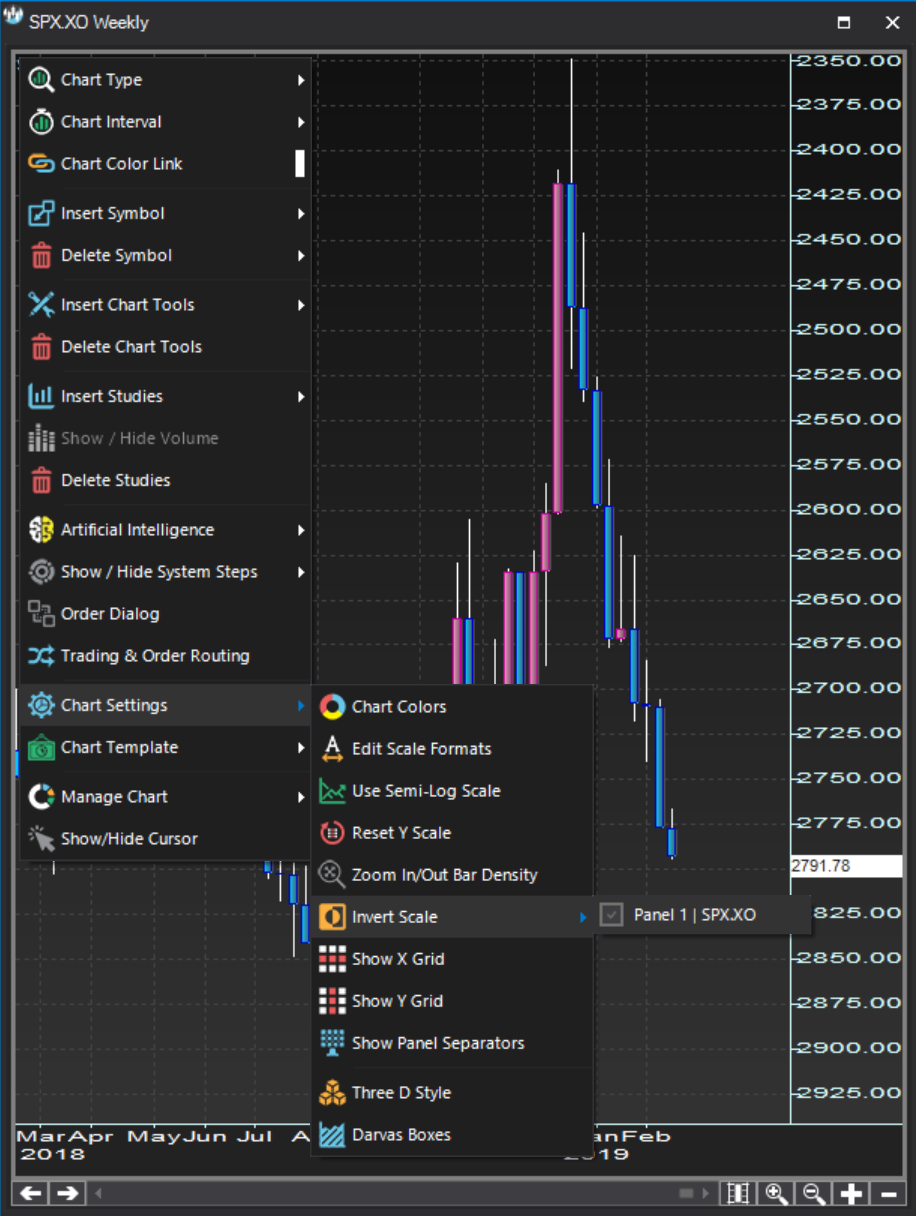
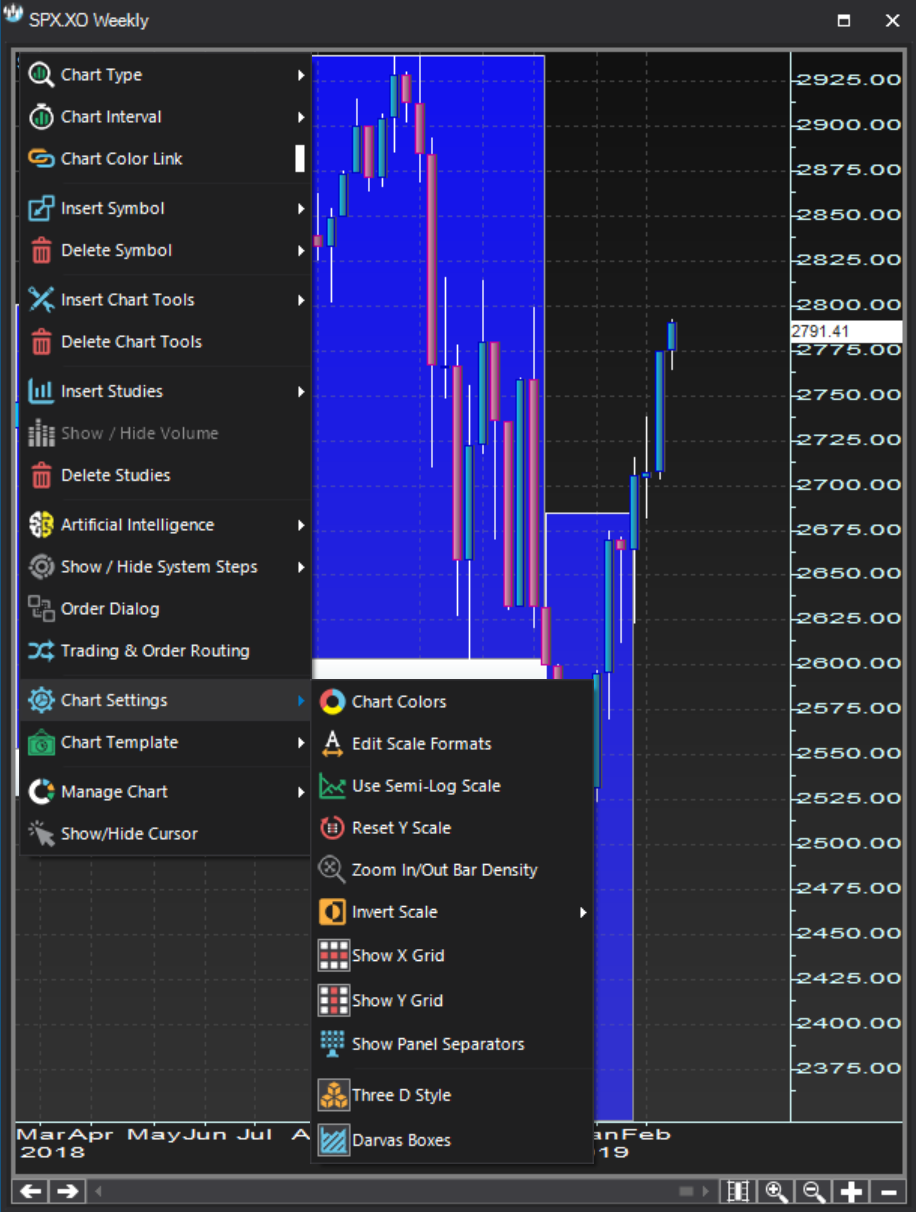
Customized Looks
Enable/disable grids and panel separators. Display 2D or 3D style charts. Show or hide darvas boxes.

All-encompassing chart templates.
Save chart looks and settings as well as built-in and custom studies layouts in easy-to-load chart templates.

Chart templates help you save the touch and feel as well as the functionality aspect of your charts so you can easily apply them to other charts.

Chart templates are saved in a default S-Trader folder and are always part of the back-up / restore operations routinely performed by the Back-Up Utility. They can also be exported in packages built with the Organizer Tool.

Once saved a Chart Template can be applied to a new chart in fractions of a second.

Full flexibility and convenience.
Edit chart names, export/import chart data to/from XL files, save charts as files, snapshots or images and pop charts up to manipulate them on larger pixel areas.

You can edit each chart’s name or price scale setup via context menu dialogs. These properties are further retained if the chart ends up being part of a specific workspace.

You can dock and undock charts to and from the platform, respectively; but you can also pop them up from their frame if you want to spread them in a specific way on a given pixel space.

You can save charts as images, snapshots containing all data as well as all other chart elements or you can store them in the Saved Charts panel for future use.

You can export charts data, including all plotted indicators, in Microsoft XL files. You can also import data from Microsoft XL files and display it on a chart provided you follow the appropriate column structure.


